FindMyHaven
FindMyHaven: Leading a location discovery app that turns data into retention loops.
How I handle ambiguity throughout end-to-end execution. Solving user decision fatigue & delivering a product architecture concept.
- Role
- Product Manager, UX Designer
- Duration
- 48 hr sprint, 1 wk iteration
- Team
- 1 PM, 4 Designers
- Tools
- Figma, Miro, Stark
The Problem & Opportunity
A $21B+ market trapped by static, outdated data.
Navigation apps boast over 2 billion MAU, yet rely on static star ratings and months-old reviews. Users making immediate decisions are met with conflicting opinions written weeks prior. Despite global usage, there is still no reliable way to gauge real-time crowding or noise levels before arrival.
 of consumers read reviews before visiting
- 97%
- of consumers read reviews before visiting
 only care about reviews from the last 3 months
- 74%
- only care about reviews from the last 3 months
 avg. reviews read before trust is formed
- 10+
- avg. reviews read before trust is formed
 top nav. apps feature live crowd & noise data
- 0 of 4
- top nav. apps feature live crowd & noise data
This friction creates an opportunity to replace searching for reviews with live telemetry.
Navigation apps end the user relationship when directions are given. They offer no live context before arrival and little reconnection after departure, forcing users into a cycle of decision fatigue. This creates an opportunity to bridge the gap between pre-arrival confidence and post-visit retention.
Current Navigation Apps
- 1Find a new location
- 2Read 10+ reviews
- 3Hope it's not too loud or crowded
- High friction & uncertainty
Proposed Telemetry Model
- 1Find a new location
- 2Check live telemetry
- 3Informed arrival every time
- Instant confidence
The Design Solution & Impact
FindMyHaven: A live telemetry engine with a $4.99/mo freemium model.
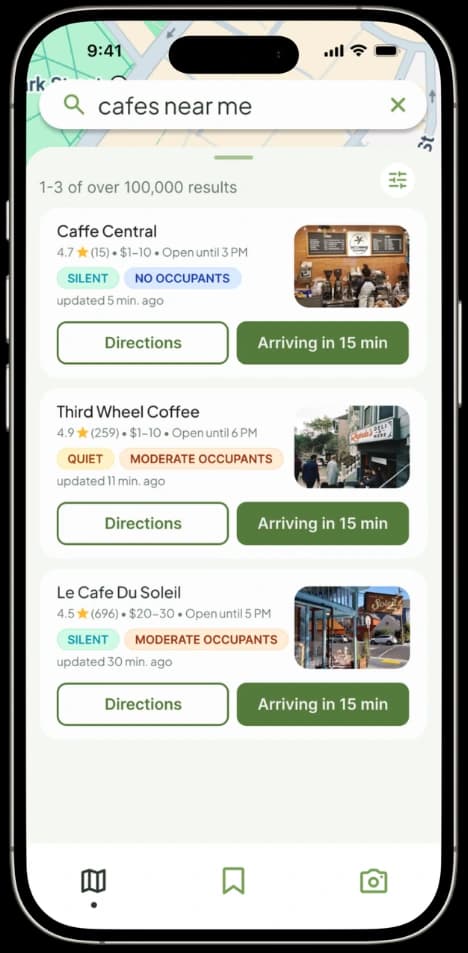
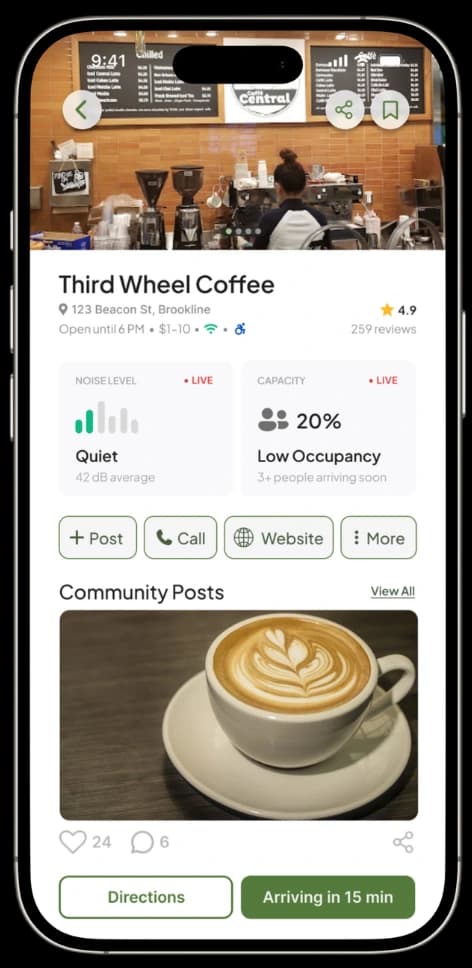
I designed FindMyHaven to transform static, outdated review-searching into immediate real-world context by converting noise levels and crowd density into live visual telemetry.
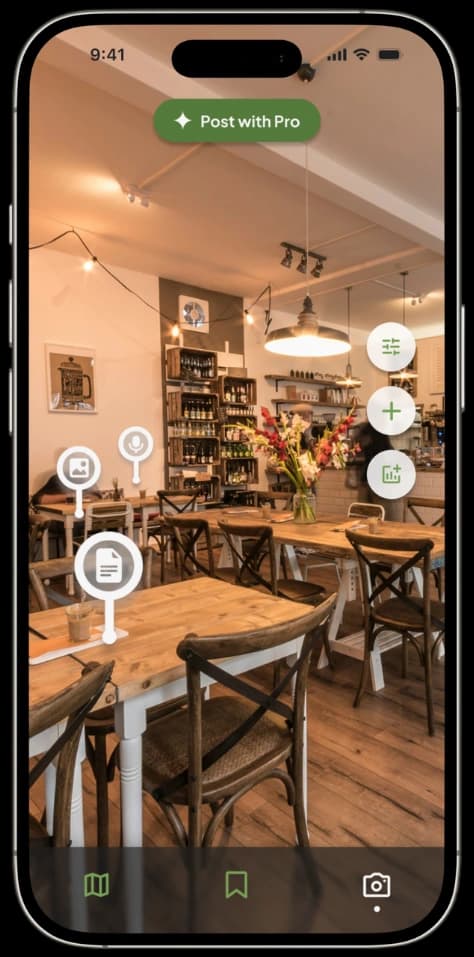
Users can instantly gauge a location’s occupancy & noise levels to eliminate decision fatigue and publish geo-anchored social media posts directly at physical locations using augmented reality (AR).
- User Decision Velocity
- Reduced the average of ~14 min. review browsing with a 3-sec. live telemetry scan, cutting evaluation down to a single glance before arrival.
- Cold-Start Architecture
- Designed a dynamic fallback UI that seamlessly shifts from real-time telemetry to crowdsourced memory cards whenever live sensor density is low.
- Geo-Anchored Retention
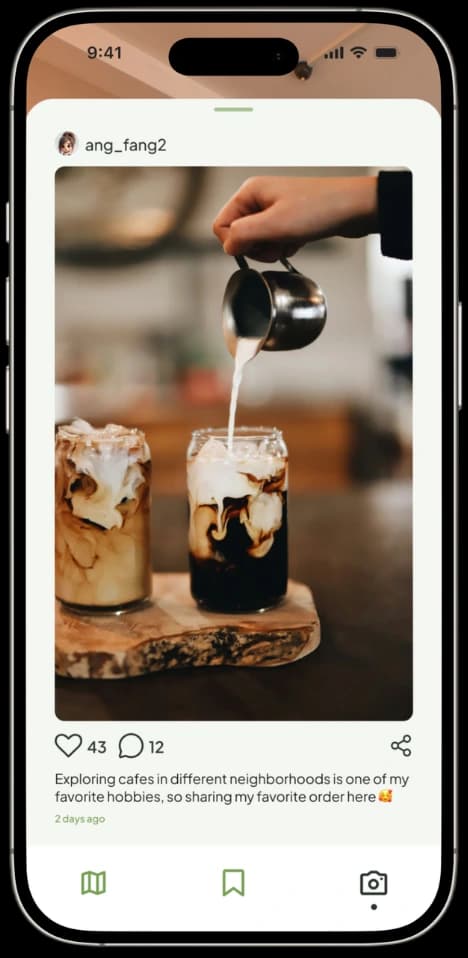
- Replaced low-engagement check-ins with AR-integrated social media, allowing users to drop persistent visual posts directly at physical coordinates.
- Freemium Business Model
- Structured the product into a free (2D telemetry) and $4.99/mo premium tier (AR HUD), establishing a path for monetization without gating core search utility.
AI-Assisted Workflow
AI-assisted, but 100% human-centered.
To move quickly without sacrificing depth, I leveraged LLMs and VLMs to synthesize qualitative survey data, cluster affinity patterns, and run stress-test design critiques against early UI drafts.
Using AI tools allowed me to maximize effort on core interaction trade-offs, UI/UX mechanics, and human emotional nuance.
The Strategic Pivot
Tension between users’ needs and initial designs.

77%
prioritize comfort and seating over price, led by cafes (45.5%) and libraries (31.8%)
“Sometimes there’s no seats or way too noisy so I can’t focus or get any work done.”

62%
seek real-time noise level and crowd occupancy data before visiting a location
“I didn’t like how overwhelming it was… sometimes you want stoicism.”

31%
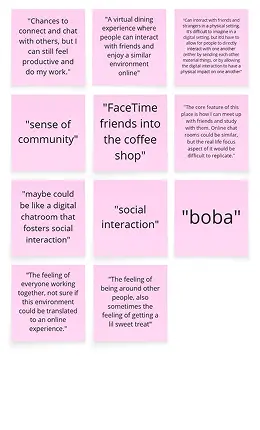
desire the feeling of community over static, non-contextual text reviews
“I enjoy physically interaction, but it's difficult to imagine in a digital setting...”
Initial Designs (V1)
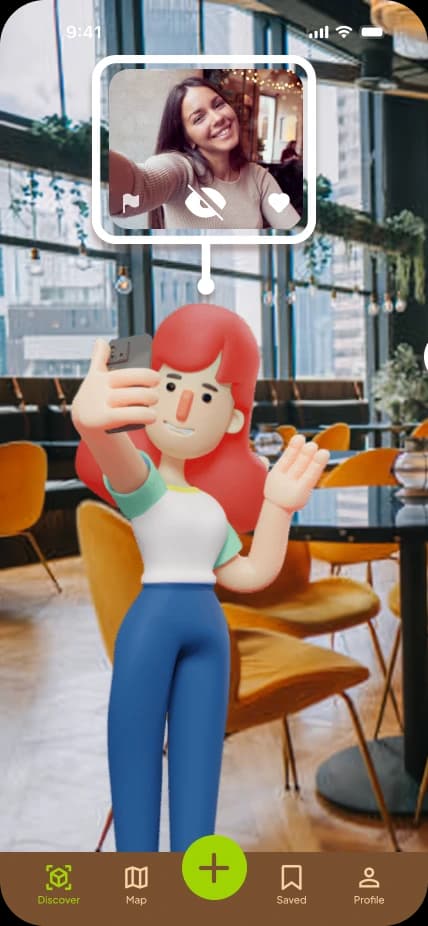
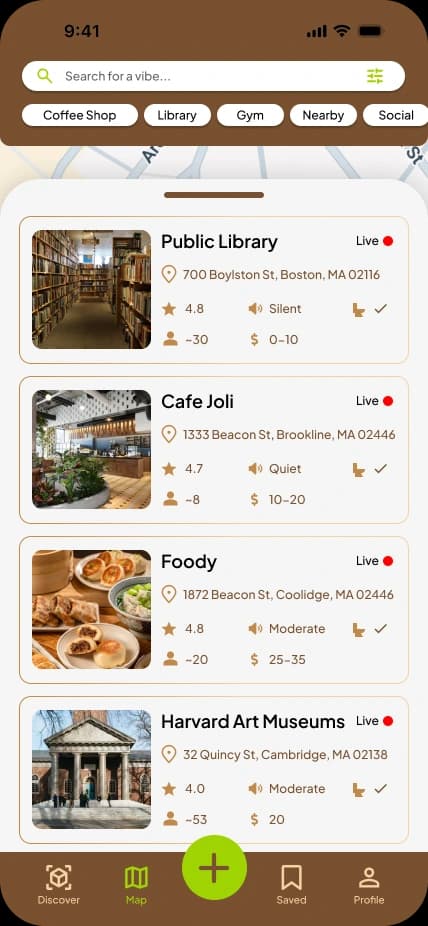
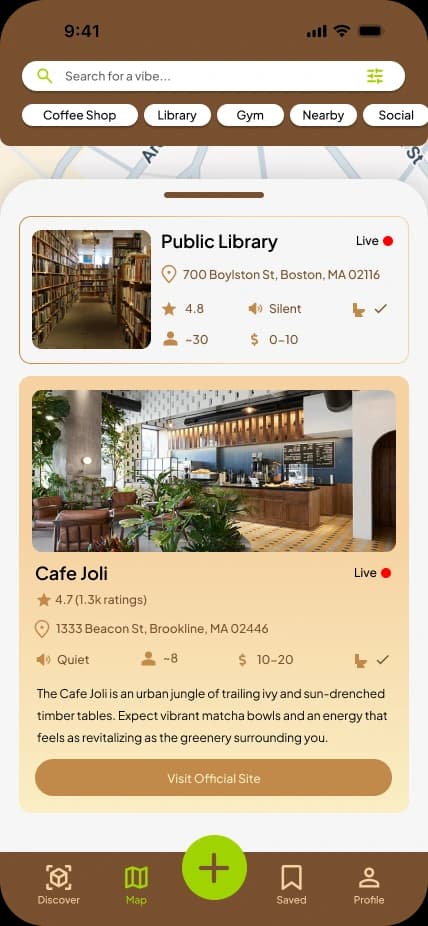
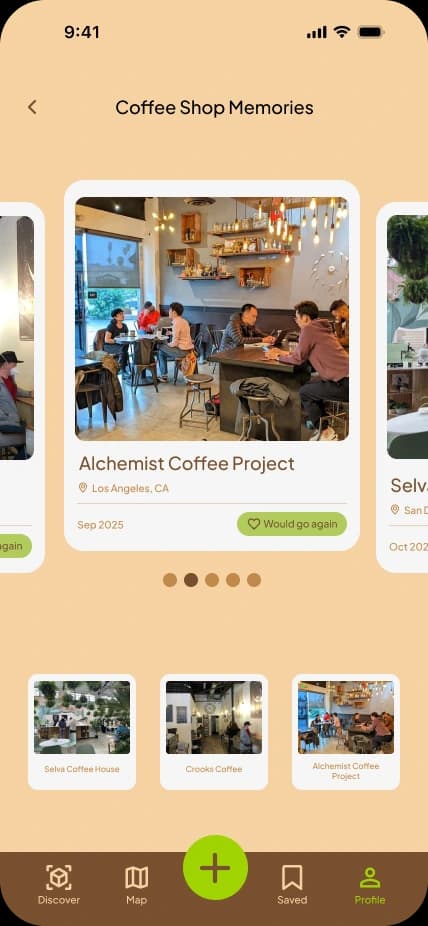
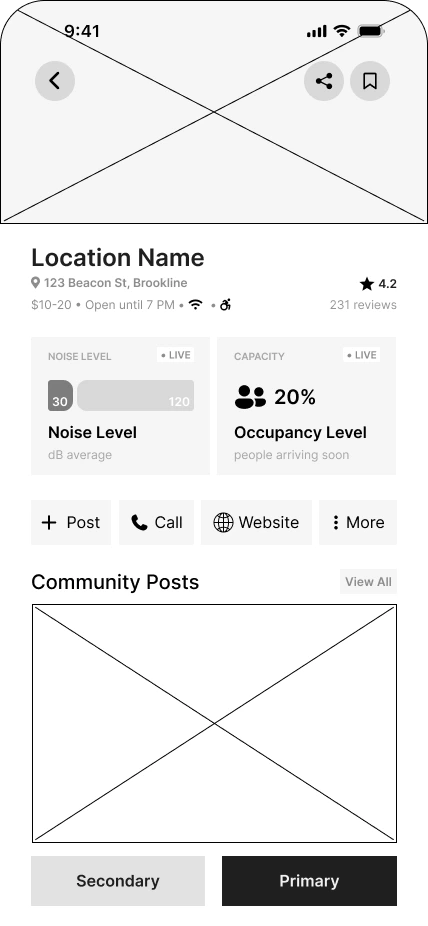
The Mismatch: While leading our team’s V1 exploration, I re-analyzed survey data and realized that our UI buried live noise and occupancy as secondary details. Upon recognizing that this clashed directly with the #1 decision factor for users, I initiated a strategic pivot to re-architect our core product.
Addressing the mismatch.
01 / V1 DESIGN
02 / RESTRUCTURE
03 / V2 REDESIGN
Taking sole ownership of the V2 redesign, I pivoted the product away from traditional static reviews toward real-time environmental telemetry.
I restructured the interface hierarchy from the ground up by elevating live noise and occupancy into focal points to eliminate arrival uncertainty and deliver instant situational context.
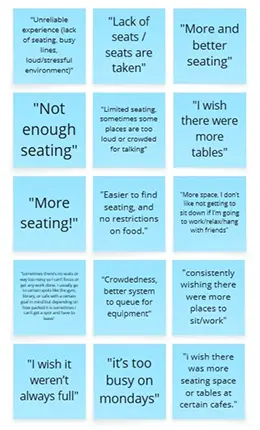
Scoping & trade-offs.
Overcrowding
Community Connection
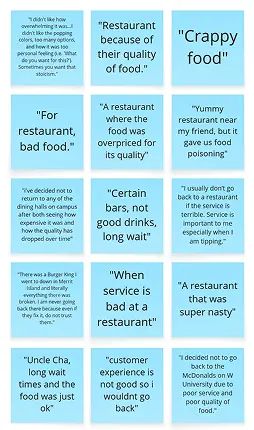
Poor Service
- Prioritized (In Scope):
- Live noise & crowd levels. These resolve primary physical bottlenecks before arrival.
- Deprioritized (Out of Scope):
- Food quality & service complaints. Subjective qualitative data is outside the scope of telemetry.
Haven’s Core Mechanics
Live telemetry & map feed (free tier).
01 / Discovery at a glance
- Live noise & occupancy data on each card
- ETA buttons prioritize transit velocity
02 / Telemetry focal point
- Simple telemetry replaces lots of text
- 3-second visual scan for room cultural fit
03 / Live reporting on-site
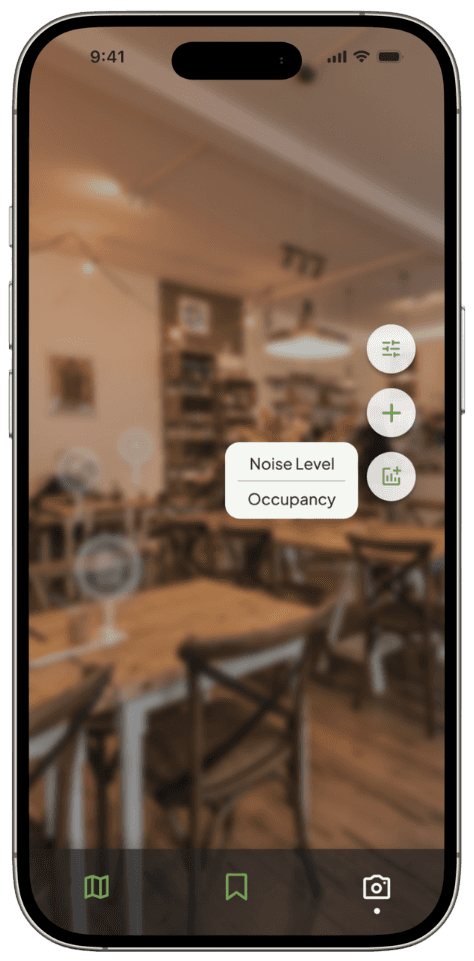
- Geofenced updates for data accuracy
- 2-tap input loop for low friction
04 / Quick telemetry logging
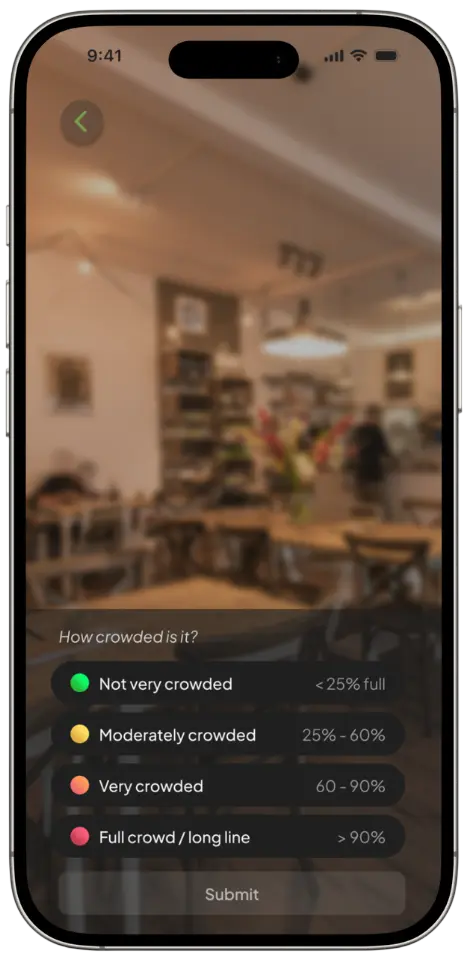
- Contextual selection for instant status entry
- User submissions update the average in real-time
AR social media posts, viewable by all (paid tier).
01 / Multimodal social media
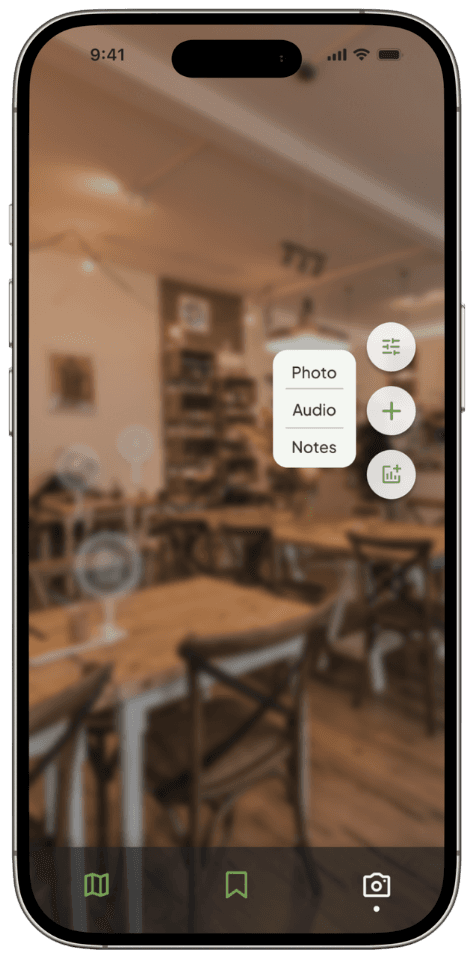
- Radial menu for photo, audio, and note inputs
- 3D anchoring posts to physical locations
02 / AR-pinned photos
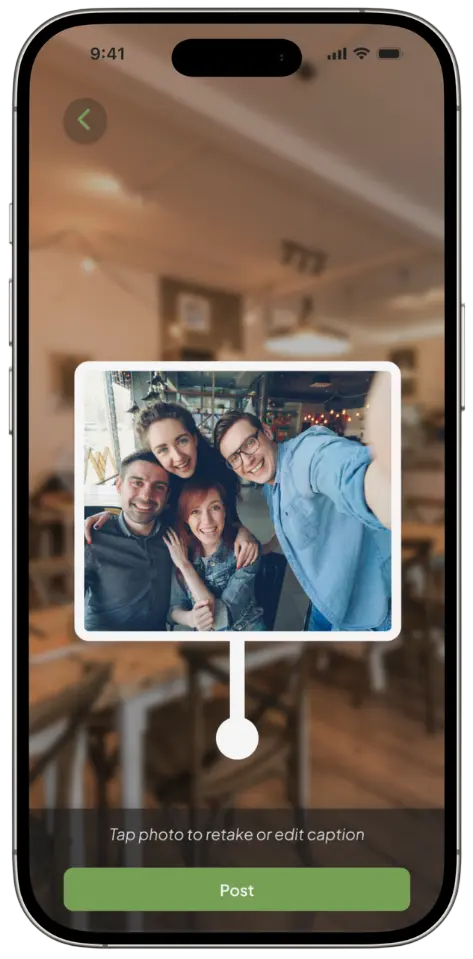
- On-site visual proof from the physical location
- Photo attachments confirm room atmosphere
03 / AR-pin audio
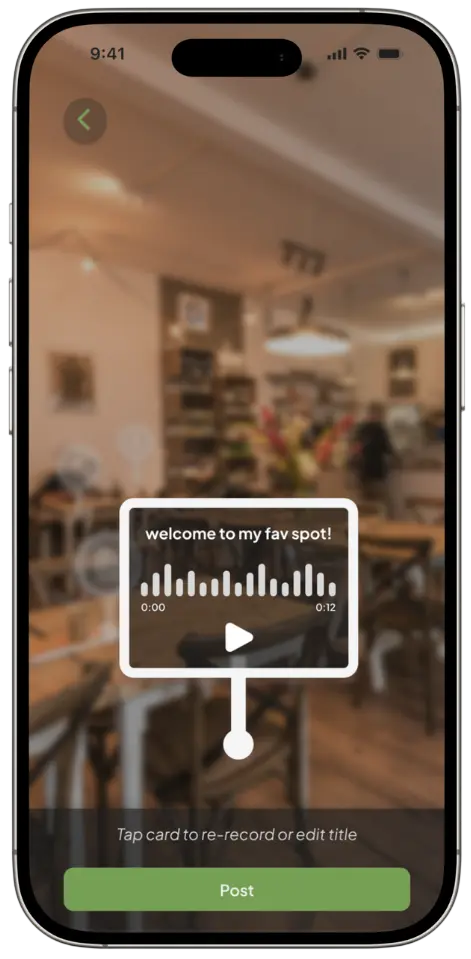
- Playable waveform previews real noise levels
- Acoustic transparency is not limited by static text
04 / AR-pinned notes
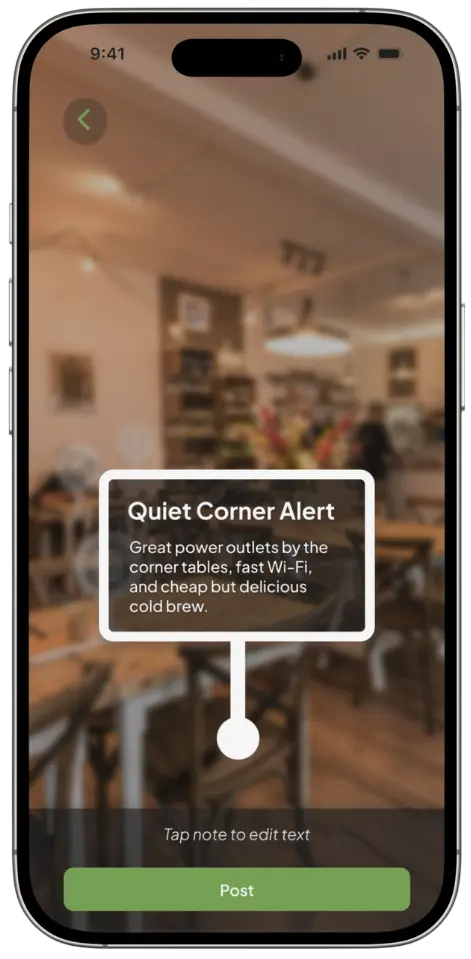
- Contextual cards highlight localized tips
- User-generated tips enrich experience for all
What-If Revenue / Business Model
FindMyHaven’s monetization & business viability.
- Freemium Conversion Model:
- Kept real-time telemetry 100% free to maximize top-of-funnel retention while monetizing unlimited AR photo, audio, and note pinning.
- B2B Partnerships:
- Local businesses pay a monthly subscription to verify their live telemetry feeds and broadcast real-time outlet availability, potentially featuring quiet seating zones during off-peak hours.
- Unit Economics Strategy:
- Crowdsourced user reporting minimizes data collection overhead, maintaining a low cost-to-serve per active monthly user.
Hand-Off
Design system & developer handoff.
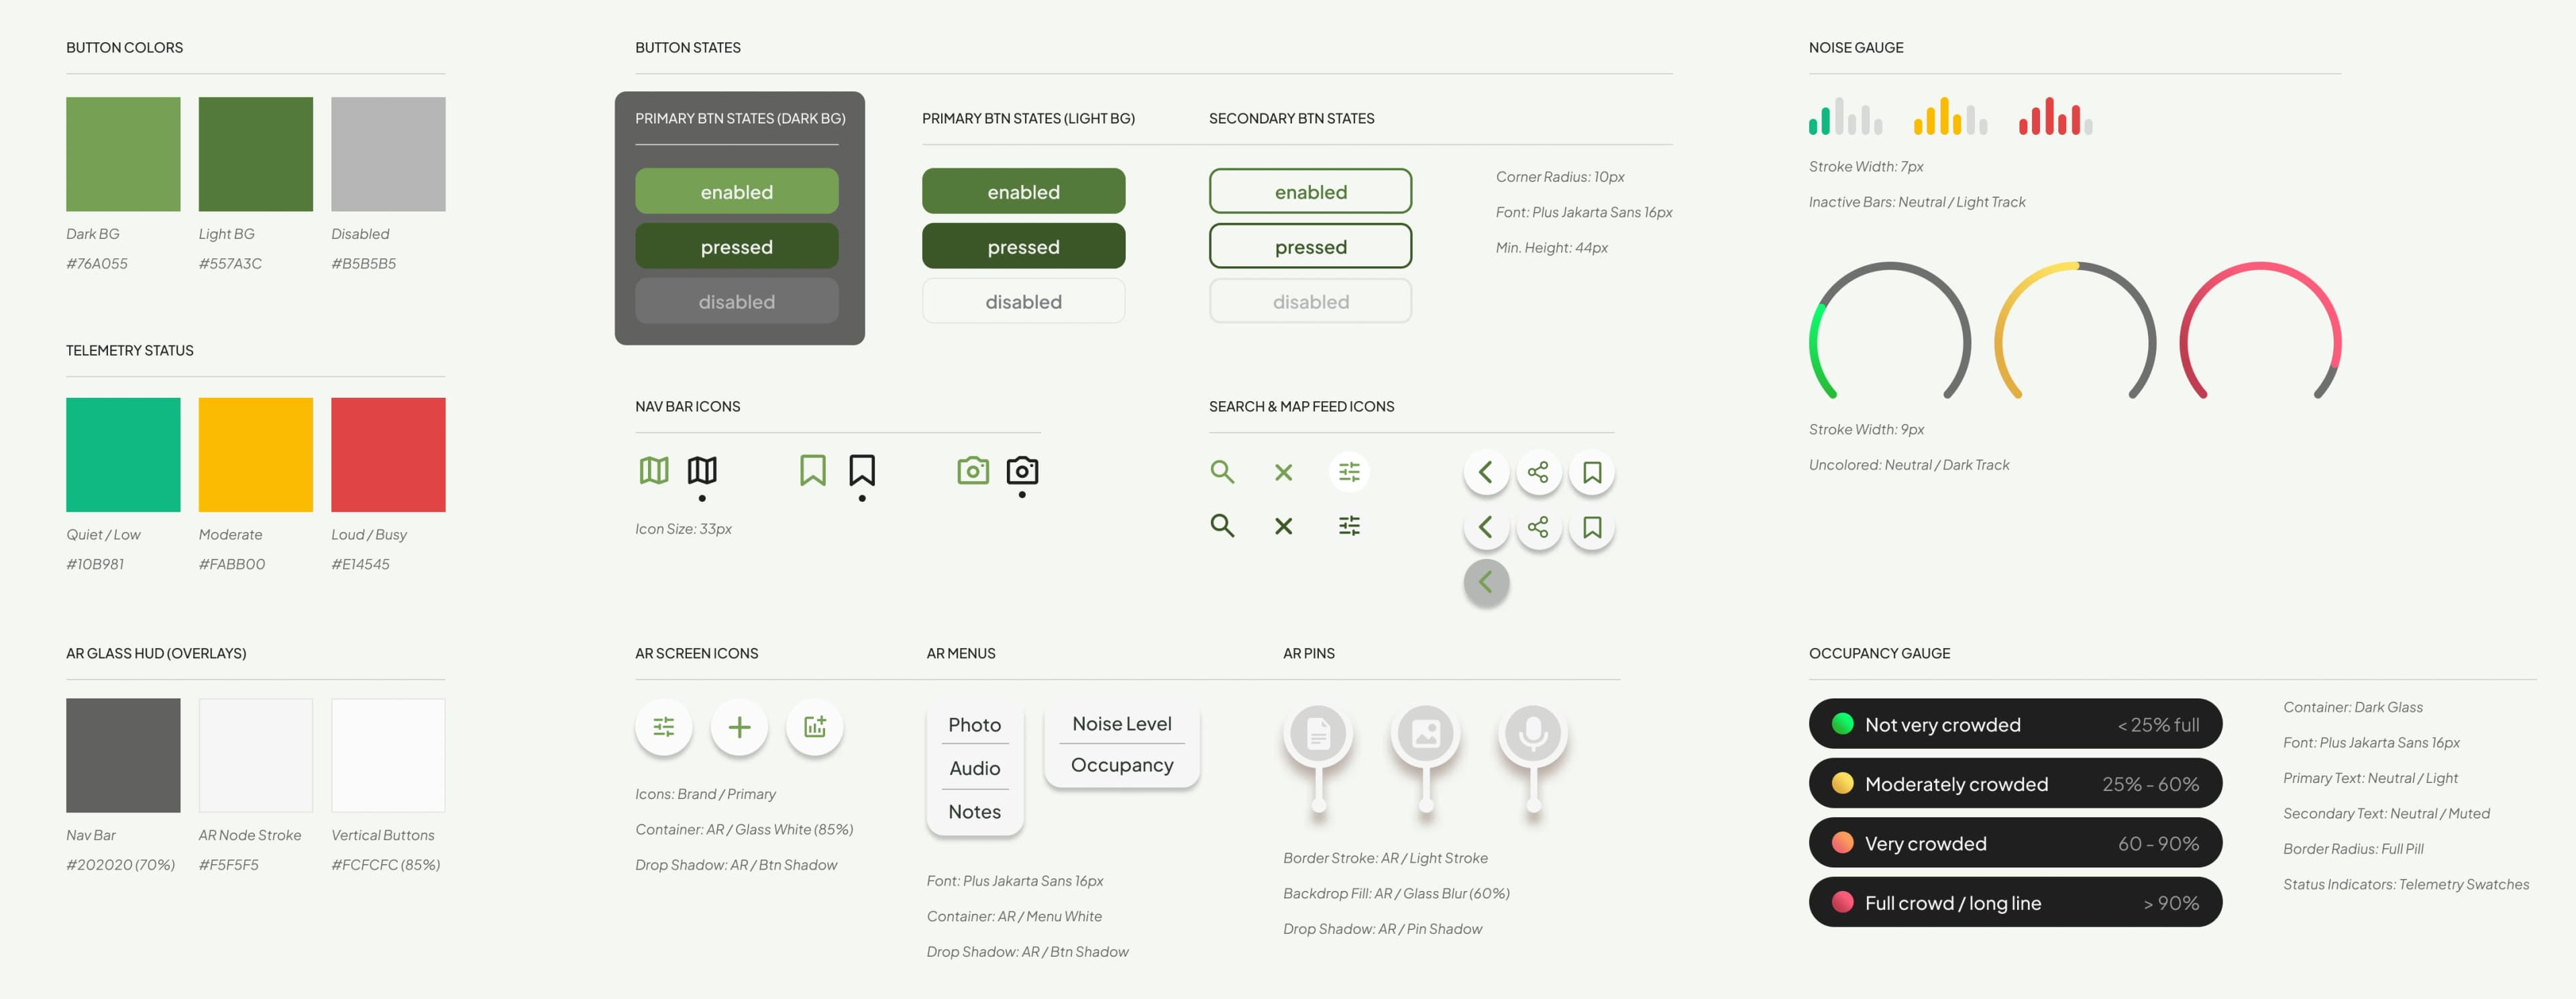
- Tokenized Component Architecture:
- Built using Figma variables mapped directly to Tailwind CSS tokens, allowing real-time telemetry UI colors and status badges to update dynamically across both web and native mobile codebases.
- Outdoor Accessibility & Spatial Contrast:
- Standardized 70% opacity dark backdrops behind all AR HUD nodes to guarantee a minimum 4.5:1 WCAG contrast ratio under sunlight, while capping active viewport pins to preserve 60 FPS rendering.
- Cross-Platform UI Standardization:
- Enforced an 8pt spatial layout grid with standardized 10px corner radii, 24px icon bounding boxes, and explicit 3-stage interactive states to eliminate handoff edge cases and streamline dev integration.
Reflection & Retrospection
The learned lessons that I’ll take with me.
- Prioritizing Clarity Over Information Density:
- I initially tried to show every piece of data at once. Distilling complex metrics into a 3-sec visual scan taught me that high-utility design relies on giving users just enough signal to act without overwhelming them.
- Designing Value Loops, Not Paywalls:
- Keeping core telemetry free while monetizing social media tools and venue features proved to me that monetization works best when it feels like a natural utility upgrade rather than an artificial barrier.
- Embracing Real-World Technical Constraints:
- Designing for AR forced me way out of my comfort zone. I had to solve outdoor WCAG contrast ratios, build a strict token system, and respect 60 FPS GPU limits before I felt truly confident handing off my designs.
Next Steps
What does FindMyHaven’s future roadmap entail?
- Real-World Usability & AR Field Testing:
- Conduct on-site testing across local cafes and study hubs to measure AR pin placement accuracy, benchmark battery drain during extended camera HUD usage, and validate noise meter readability under direct sunlight.
- Automated Sensor & B2B Telemetry:
- Pilot hardware noise sensors with partner cafes to transition high-foot-traffic venues from crowdsourced reports to automated, sub-second telemetry updates directly on the merchant portal.
- Accessibility & Screen Reader Mapping:
- Extend the design system to include auditory spatial cues and haptic feedback loops, ensuring visually impaired users receive spoken telemetry updates and screen-reader-supported seat navigation.
Thanks for diving into FindMyHaven with me!
I’m currently looking for Product Design opportunities where I can solve complex system problems and use my craft for successful business strategies.